TL;DR
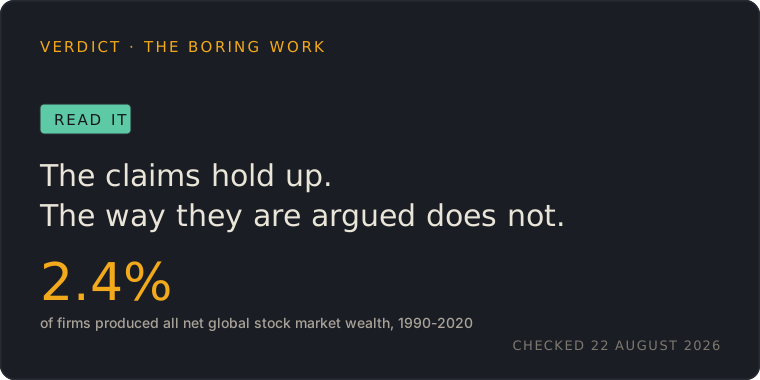
- The chapter on tail events is right, and the numbers are bigger than the book’s: across 64,000 global stocks, the top 2.4% of firms account for all net wealth creation from 1990 to 2020, and 55.2% of US stocks lost to one-month Treasury bills.
- That same fact is why the book’s opening story about a frugal janitor cannot work as evidence. In a distribution that lopsided, a rich outlier turns up whatever anybody’s method was.
- Behaviour costing money is measured: among 66,465 brokerage households, those that traded most earned 11.4% a year while the market returned 17.9%.
- «No one’s crazy» has a natural experiment behind it: people who lived through poor stock returns take less financial risk for the rest of their lives.
- «Enough» holds for some people only. In a joint reanalysis by two researchers who had disagreed, happiness levelled off with income only among the least happy.
Nothing on this page is investment advice. It makes no recommendation about what to buy, how much to save or how to allocate anything, and no forecasts. It checks the book’s claims about behaviour against the data they can be measured with.
Verdict
Read it, with one correction. Four of its seven checkable claims hold on very large datasets, which is a better record than almost anything else on this shelf. The weak point is the way it argues for them: with biographies of lucky individuals, in a book whose central lesson is that individual outcomes are dominated by luck.
Seven claims that can be checked
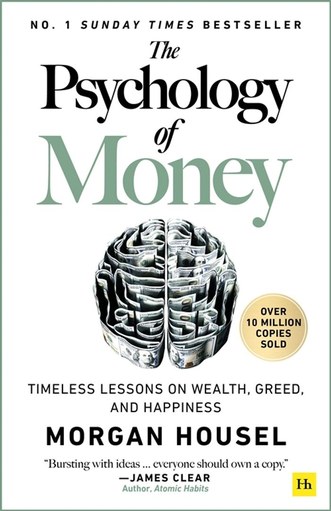
Morgan Housel, a partner at the venture firm Collaborative Fund and a former columnist at The Motley Fool, grew the 2020 book out of a long essay on his firm’s blog. The framing, in that essay’s words: «Managing money isn’t necessarily about what you know; it’s how you behave», and «Investing is not the study of finance. It’s the study of how people behave with money» (Housel, 2018).
That is a claim about where the differences between people come from, and it can be checked. So can the chapters on tail events, on how a generation’s experience shapes its risk-taking, on compounding and on knowing when you have enough. To test the author’s wording rather than a paraphrase, the quotations here come from his own published texts.

A few stocks carry the whole market
«Long tails drive everything. They dominate business, investing, sports, politics, products, careers, everything», Housel writes, and «anything that is huge, profitable, famous, or influential is the result of a tail event» (Housel, 2022).
The finance literature measured this on more than 64,000 stocks from around the world between 1990 and 2020: «the top-performing 2.4% of firms account for all of the $US 75.7 trillion in net global stock market wealth creation». Outside the United States the figure is 1.41% of firms. Most listed companies lost to the dullest alternative available: «55.2% of U.S. stocks and 57.4% of non-U.S. stocks underperform one-month U.S. Treasury bills in terms of compound returns» (Bessembinder et al., 2023).
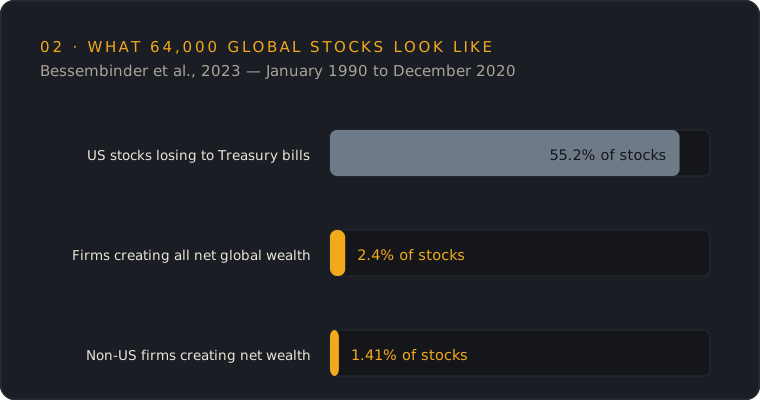
Picture a lottery where you buy a hundred tickets. More than half lose money against cash in a drawer, and two or three of them pay for everything. That is the stock market as measured over thirty years. The benchmark matters, too: a one-month Treasury bill is a four-week loan to the US government, about the closest thing finance has to cash earning a little interest, and more than half of all American shares failed to beat it.
One disclosure belongs here. The study records funding from the investment manager Baillie Gifford alongside a Hong Kong public research grant. That does not change the arithmetic, which is a count of every listed stock, not a survey, but it should be visible. An earlier US-only study by the same lead author reported the same shape (Bessembinder, 2018); I could not open its abstract, so no figure from it appears here.
The janitor problem
The essay opens with two people whose paths crossed. Grace Groner, a secretary who lived alone in a one-bedroom house, left a fortune to charity after decades of quiet investing. Richard Fuscone, a former Merrill Lynch executive, went bankrupt the same year. In the book the secretary is replaced by Ronald Read, a petrol-station attendant and janitor who left millions, but the executive and the lesson stay the same: behaviour beats credentials.
Hold that opening against the numbers in the previous section. In a market where 2.4% of companies produce all the net gains and most stocks lose to Treasury bills, a millionaire janitor is something the lottery of tails has to produce now and then. Hold a handful of stocks for fifty years and, across millions of savers, somebody lands on the jackpot column. That person gets a newspaper profile. The thousands of equally frugal people whose handful of stocks lost to cash do not.
This is survivorship bias, and here it is the book’s own thesis turned on the book’s own evidence. If tails drive everything, then no single outcome, however striking, tells you what produced it. The story shows that such a life is possible, and cannot carry more weight than that. The swap between the essay and the book makes the same point from another angle: two different frugal heroes fit the same slot in the argument, which tells you the slot is doing the persuading.
None of this makes the stories useless. They make a claim memorable, which is what stories are for. The irony is that a sturdier version of the same lesson sits a chapter away. If most stocks lose and a tiny handful carry everything, then owning everything for decades is the behaviour that guarantees you hold the tail, and picking a few stocks is the behaviour that risks missing it. That argument needs no janitor; it is arithmetic.
Fidgeting costs money
On whether behaviour beats knowledge, the book stands on solid ground. Researchers followed 66,465 households at a large discount broker from 1991 to 1996: «those that trade most earn an annual return of 11.4 percent, while the market returns 17.9 percent» (Barber & Odean, 2000). Six and a half percentage points a year lost to activity, which compounded over a working life dwarfs anything a finance course could add.
The pattern returned with a generation of app users the book was written before. On Robinhood, a commission-free trading app, intense buying of attention-grabbing stocks forecast losses: the top stocks bought each day averaged 20-day abnormal returns of −4.7% (Barber et al., 2022).
Where the claim overreaches is the second half, that knowledge barely matters. The strongest support for that view came six years before the book: across 168 papers, «interventions to improve financial literacy explain only 0.1% of the variance in financial behaviors studied», with effects fading to almost nothing 20 months on (Fernandes et al., 2014).
A later meta-analysis of 126 impact evaluations reached a different conclusion: «financial education significantly impacts financial behavior and, to an even larger extent, financial literacy», including in the randomised trials, though it worked less well for low-income clients and depended on intensity and on reaching people at a «teachable moment» (Kaiser & Menkhoff, 2017).
Those two findings fit together better than they first appear. One asks how much of everyday financial behaviour general literacy explains, the other asks whether a well-timed course moves it. Teaching works when it arrives at the moment of a decision and fades otherwise, which is a more useful sentence than either «knowledge doesn’t matter» or «educate everyone».
And there is a measured ceiling on how much any of this depends on what people know. In 41 million observations covering the population of Denmark, about 85% of people were passive savers who ignored tax subsidies for retirement saving but were «heavily influenced by automatic contributions made on their behalf» (Chetty et al., 2014). Behaviour decides, and what moves behaviour at scale is the default setting, not the insight.
«No one’s crazy», measured
The book’s first chapter argues that money decisions that look irrational from outside make sense given what a person lived through. It reads like a metaphor, and it has been measured.
Using the US Survey of Consumer Finances from 1960 to 2007, and controlling for age, year and household characteristics, two economists found that «individuals who have experienced low stock market returns throughout their lives so far report lower willingness to take financial risk, are less likely to participate in the stock market, invest a lower fraction of their liquid assets in stocks if they participate, and are more pessimistic about future stock returns». Recent experience counted most, especially for younger people (Malmendier & Nagel, 2011).
This is the book’s strongest chapter and one of its least quoted. A grandmother who distrusts shares and a colleague who piles into them are both reasoning from evidence, from different lifetimes of it. Someone who lived through a decade of losses and stays out of the market is not failing to understand compounding; they are pricing risk from the data their life supplied. Quoting them the historical average return does not reach them, which is close to the book’s point, and better supported than the book’s own version of it.
Enough, and where the line falls
The chapter on «enough» argues that having no stopping point destroys fortunes. The neighbouring popular claim, that happiness stops rising above a certain income, went through an unusual public correction while the book was on shelves.
First, 1,725,994 momentary reports from 33,391 employed US adults found that «both experienced and evaluative well-being increased linearly with log(income)», with no sign of a plateau above $75,000 a year (Killingsworth, 2021).
Then two researchers who had published opposite findings reanalysed the data together. «A reanalysis of Killingsworth’s experienced sampling data confirmed the flattening pattern only for the least happy people. Happiness increases steadily with log(income) among happier people, and even accelerates in the happiest group» (Killingsworth et al., 2023).
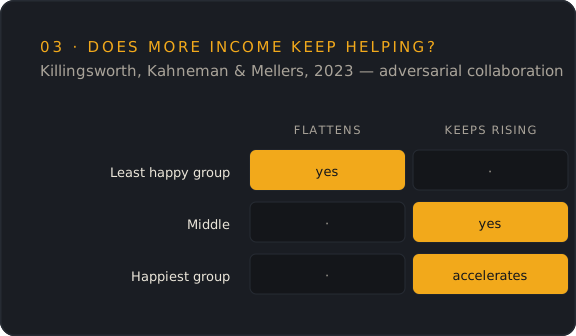
So a ceiling on what money does for mood exists for the unhappiest people and not as a general law; for everyone else, more income kept going with more well-being. The tested version of the chapter’s advice is humbler and more practical: in a field experiment, working adults reported more happiness after spending money on something that saved them time than after a material purchase (Whillans et al., 2017).
Who should read it
Read it. It is short, and the chapters on tails and on generational experience are worth the price on their own; both turn out stronger than the book claims, not weaker.
Read it with the correction, because the correction is the book’s own argument. Every biography of a successful saver or investor is drawn from the tail of a distribution the book itself describes as tail-dominated, which makes such stories unusable as evidence about method, including the two it opens with.
The same shelf with far weaker evidence behind it: Rich Dad Poor Dad, reread sceptically and Secrets of the Millionaire Mind. For the money-and-happiness research in more depth, see the happiness myths, and the whole list of checked books lives under book reviews.
The boring bottom line
Tails drive everything: 2.4% of firms produced all the net wealth in world stock markets between 1990 and 2020, and more than half of US stocks lost to Treasury bills. Trading more cost the busiest households six and a half points a year. A lifetime of market experience shapes risk-taking for good. Three claims, three large datasets, three confirmations, and none of them needed a biography.
The weak spots are smaller than the strengths. «Knowledge barely matters» is too strong, since well-timed education moves behaviour and defaults move it far more. «Enough» describes the least happy, not everyone. And the janitor who beat the professionals is what a tail-dominated market produces on its own, which is the one thing this book of all books should have seen.
Sources
- Housel, M (2018). The psychology of money — the author's essay that became the book. Collaborative Fund. Read on 22 August 2026. Quoting the author's own text means the claims tested here are his wording rather than a summary of the book. collabfund.com
- Housel, M (2022). Tails, you win. Collaborative Fund. Read on 22 August 2026. The claim this page confirms, and the one that undercuts the book's own use of anecdotes. collabfund.com
- Bessembinder, H., Chen, T. F., Choi, G., & Wei, K. C. J (2023). Long-term shareholder returns: Evidence from 64,000 global stocks. Financial Analysts Journal. 79(3), 33-63. The claim about tails, measured on the largest available dataset. Funding recorded in Crossref: Baillie Gifford & Company and the Research Grants Council of Hong Kong. doi:10.1080/0015198X.2023.2188870
- Bessembinder, H (2018). Do stocks outperform Treasury bills?. Journal of Financial Economics. 129(3), 440-457. The US predecessor of the global study above, cited as the earlier result rather than for its numbers. doi:10.1016/j.jfineco.2018.06.004
- Barber, B. M., & Odean, T (2000). Trading is hazardous to your wealth: The common stock investment performance of individual investors. The Journal of Finance. 55(2), 773-806. The cleanest demonstration that behaviour, not knowledge, is where the money goes. doi:10.1111/0022-1082.00226
- Barber, B. M., Huang, X., Odean, T., & Schwarz, C (2022). Attention-induced trading and returns: Evidence from Robinhood users. The Journal of Finance. 77(6), 3141-3190. The modern counterpart to the 2000 study: intense buying by Robinhood users forecast negative returns, with average 20-day abnormal returns of −4.7% for the top stocks bought each day. doi:10.1111/jofi.13183
- Fernandes, D., Lynch, J. G., Jr., & Netemeyer, R. G (2014). Financial literacy, financial education, and downstream financial behaviors. Management Science. 60(8), 1861-1883. Published six years before the book, and the strongest quantitative support for its central claim. doi:10.1287/mnsc.2013.1849
- Kaiser, T., & Menkhoff, L (2017). Does financial education impact financial literacy and financial behavior, and if so, when?. World Bank Economic Review. 31(3), 611-630. The counterweight: teaching does change behaviour, under conditions the book does not mention. doi:10.1093/wber/lhx018
- Chetty, R., Friedman, J. N., Leth-Petersen, S., Nielsen, T. H., & Olsen, T (2014). Active vs. passive decisions and crowd-out in retirement savings accounts: Evidence from Denmark. Quarterly Journal of Economics. 129(3), 1141-1219. The quantitative boundary on «behaviour decides»: what changes behaviour at scale is architecture, not insight. doi:10.1093/qje/qju013
- Malmendier, U., & Nagel, S (2011). Depression babies: Do macroeconomic experiences affect risk taking?. Quarterly Journal of Economics. 126(1), 373-416. Direct empirical support for the book's «no one is crazy» chapter. doi:10.1093/qje/qjq004
- Killingsworth, M. A (2021). Experienced well-being rises with income, even above $75,000 per year. Proceedings of the National Academy of Sciences. 118(4), e2016976118. The first half of a dispute the field then resolved in public. doi:10.1073/pnas.2016976118
- Killingsworth, M. A., Kahneman, D., & Mellers, B (2023). Income and emotional well-being: A conflict resolved. Proceedings of the National Academy of Sciences. 120(10), e2208661120. Two researchers with opposite published findings resolving it together — rare, and directly relevant to «enough». doi:10.1073/pnas.2208661120
- Whillans, A. V., Dunn, E. W., Smeets, P., Bekkers, R., & Norton, M. I (2017). Buying time promotes happiness. Proceedings of the National Academy of Sciences. 114(32), 8523-8527. The closest tested version of the book's claim that money's real return is control over your time. doi:10.1073/pnas.1706541114