Every claim on this site gets a grade, a date and a list of the papers behind it. This one sits in the registry of checked claims.
TL;DR
- No study stands behind the sentence. Its earliest documented appearance in print is a 2005 book epigraph crediting the American motivational speaker Jim Rohn, and the trail back to Rohn himself runs through a story about an unidentified caller on a teenager’s answering machine.
- Rohn’s own website carries two articles defending the line. Both are bylined “written based on the teachings of Jim Rohn”, both were published in 2026, seventeen years after he died, and neither cites a study.
- The sentence never says what is being averaged (income, weight, character?) so as stated there is nothing to measure, and nobody has measured it. Of the 23 top-ranking pages we read, not one produces a study of the claim itself.
- The study people reach for when pressed is the Framingham obesity network — a friend becoming obese raised your odds 57%. The same family of models, applied to a different sample, also finds that acne, headaches and height spread through friendships.
- Where peers are assigned rather than chosen, influence is real, narrow and small: one standard deviation of roommate grades moves your own by about .05, binge drinking travels between assigned students and smoking does not, and the one attempt to engineer better peer groups left the targeted students worse off.
You have probably been told to make the list. Write down the five people you spend the most time with, look at what they earn, how they eat and what they talk about on a Friday night, and accept that this is roughly what you are becoming. Fitness coaches say it. Founders say it to each other. Someone says it at every second graduation ceremony. And the advice that follows is always the same: keep whoever raises your average, and see less of whoever lowers it.
Put that way, the claim is a piece of arithmetic: five inputs, one mean, and a person as the output. Arithmetic can be checked, and the checking starts with three questions the sentence never survives — measured how, on what scale, over what period? This entry answers them in three steps, and the steps are worth naming in advance, because each one moves to a different place. First, where the line came from and who can be shown to have said it. Second, the study people produce when you ask them for evidence, and how much weight it can carry. Third, the part worth keeping: what happens to a person when a coin toss decides who sits next to them.
Where does the line come from?

The earliest instance anyone has found in print is 2005. It appears as an epigraph on page 189 of The Success Principles, by the American self-help authors Jack Canfield (co-creator of the Chicken Soup for the Soul series) and Janet Switzer, credited to “Jim Rohn, self-made millionaire and successful author”. Canfield’s book also supplies the provenance, and the provenance is the interesting part: the American writer Tim Ferriss, later the author of The 4-Hour Workweek, recounts hearing the line around 1989, aged twelve, from an unidentified caller who left it on an answering machine and attributed it to Rohn.
Garson O’Toole, the American researcher who traces quotations for a living at the site Quote Investigator, went through newspaper and book archives and landed on a careful formulation: the attribution to Rohn is tentative, and the support for it is weak. Rohn spoke for four decades, mostly on tape, and that archive is not indexed anywhere a search engine can reach — so an earlier instance may well exist. What does not exist is a citation.
Rohn’s own site does not help. jimrohn.com publishes two pages on the saying, dated February and March 2026 and bylined “written based on the teachings of Jim Rohn”. Rohn died on 5 December 2009. The pages credit the American businessman Earl Shoaff, who mentored Rohn in the 1950s, for a three-part framework about whom to associate with (disassociate, limit, expand) which is advice about company, not a formula about averages. Neither page names a single study.
The five and the average arrive separately. The American psychiatrist Daniel Amen put the question “who are the five people you spend the most time with?” in Parade in September 1989 — the same year Ferriss remembers the answering machine. The averaging form shows up in print in 2005, in a self-published book about income, attributed to nobody at all. Two halves of a sentence, floating, then fused.
The Aristotle attribution is decoration. Pages that want the line to feel ancient hand it to Aristotle or Confucius. When Psychology Today made that move in August 2025, its entire reference list was a podcast episode and “Rohn, J. (1980s–1990s)”. O’Toole’s fifteen-citation history of this proverb family names neither philosopher.
What is old is the weaker proverb underneath. The German writer Johann Wolfgang von Goethe put it as “tell me with whom you associate, and I will tell you who you are” in his Maximen und Reflexionen. Sancho Panza quotes the same idea as already worn out in the second part of the Spanish novel Don Quixote in 1615, and Latin had it as noscitur a sociis — a man is known by his companions. Every one of those says your company reveals something about you. None of them says you are its mean, and none of them counts to five.
Has anyone tested it?
No. Two things stand behind that word.
The claim names no unit. Average of what — income, conscientiousness, body weight, optimism, the quality of a résumé? Over what period, measured against whom? To run the test you would have to identify the five, measure everyone on some scale, compute their mean, and track the person’s own value as the group changed. Nobody who says the sentence has ever specified the first step, and a claim with no unit cannot come back wrong — which is exactly what keeps it in circulation. Compare the 21-day habit rule: it named a unit, so it could be measured, and it was found wrong.
Nobody who repeats it produces a source. We read every page Google put on its first screen for three ways of typing the question — 23 readable pages on 19 August 2026. Seven state the averaging claim as true. Fourteen name some source for the line, eleven of those naming Jim Rohn and nobody earlier. Seven point at a study of some kind, and the figure most often produced as research is a claim that 95% of your success is set by the people you associate with, credited to the American psychologist David McClelland and carried without a citation on four separate pages.
What does exist is a large body of work on whether the people around you change your behaviour. It is the subject of the rest of this piece, it has been measured under conditions the slogan never imagines, and it does not say what the slogan says.
Why five, then?
Five is not an arbitrary number, though the place it comes from has nothing to do with averaging. Work by the British anthropologist Robin Dunbar and colleagues describes human networks as layers that scale by a factor of roughly three: an innermost support clique of three to five people, then a sympathy group of nine to fifteen, then thirty to forty-five, and outward (Zhou, Sornette, Hill & Dunbar, 2005). The innermost layer (the people you would turn to in a crisis) was measured at around five in survey work a decade earlier (Dunbar & Spoors, 1995).
So five is a defensible count of how many people you can hold close. It is a statement about capacity, and it says nothing about what those people do to your income or your character.
Four words you need for the rest of this
From here on the argument runs on numbers taken from real studies, and four terms keep coming back. They are worth two minutes now, once, so that nothing below needs a second reading.
Confidence interval. The range the true figure probably sits in. “57% (6 to 123)” means the best single guess is 57, while anything between 6 and 123 fits what was observed. A wide range is a weak measurement wearing a precise-looking number on the front.
Confounder. Something that moves two things at once and makes them look connected. Friends share a neighbourhood, a canteen, a payday and a winter — their weight can rise together with nobody influencing anybody.
Controls and fixed effects. Arithmetic for stripping the shared background out. The strictest version compares a person with themselves at a different time, so everything permanent about them (where they grew up, how tall they are, what they earn) drops out of the comparison.
Random assignment. A coin decides who ends up beside whom. It is the only clean way to study this question, because once a coin has chosen, similarity between the two people cannot be the explanation for anything that follows.
What about the study everyone cites?
Push for a source and you usually get one particular set of papers, so here they are, described accurately — they are ambitious work, and the popular version of them is not what they found.
Framingham is a town in Massachusetts where a heart study has followed the same families since 1948. To stay in touch with participants, the study kept contact sheets: who to call if this person moves. Nicholas Christakis, an American physician and sociologist then at Harvard, and James Fowler, a political scientist at the University of California, San Diego, realised those sheets described a social network, and reconstructed it — 12,067 people, 38,611 ties, seven examinations between 1971 and 2003. Then they asked whether obesity travelled along it.
Their answer, published in 2007, is the number you have met second-hand: when a friend became obese, a person’s own odds of becoming obese rose by 57%, with a confidence interval running from 6 to 123 (Christakis & Fowler, 2007). Along the rest of the network:
- friends who each named the other — 171%
- brothers and sisters — 40%
- husbands and wives — 37%
- next-door neighbours — nothing at all
Two companion papers found the same shape elsewhere: quitting cigarettes travelled between spouses and friends (Christakis & Fowler, 2008), and so did happiness, provided the friend lived within a mile (Fowler & Christakis, 2008).
Two details rarely survive the retelling. The friendship record is thin — fewer than half the participants named a friend at all, about 0.7 ties each, because these were administrative contact sheets rather than a survey of who mattered to whom. And the effect ran through named friends while neighbours showed nothing, so proximity was not doing the work.
Notice also the distance between what the papers claim and what the slogan claims. Christakis and Fowler describe influence reaching three steps out (friends of friends of friends) at roughly 45%, 20% and 10% of excess risk. That is a statement about a whole network of thousands of people. It is not a formula that averages five named individuals, and neither author has ever offered one.
Why that study cannot carry the claim
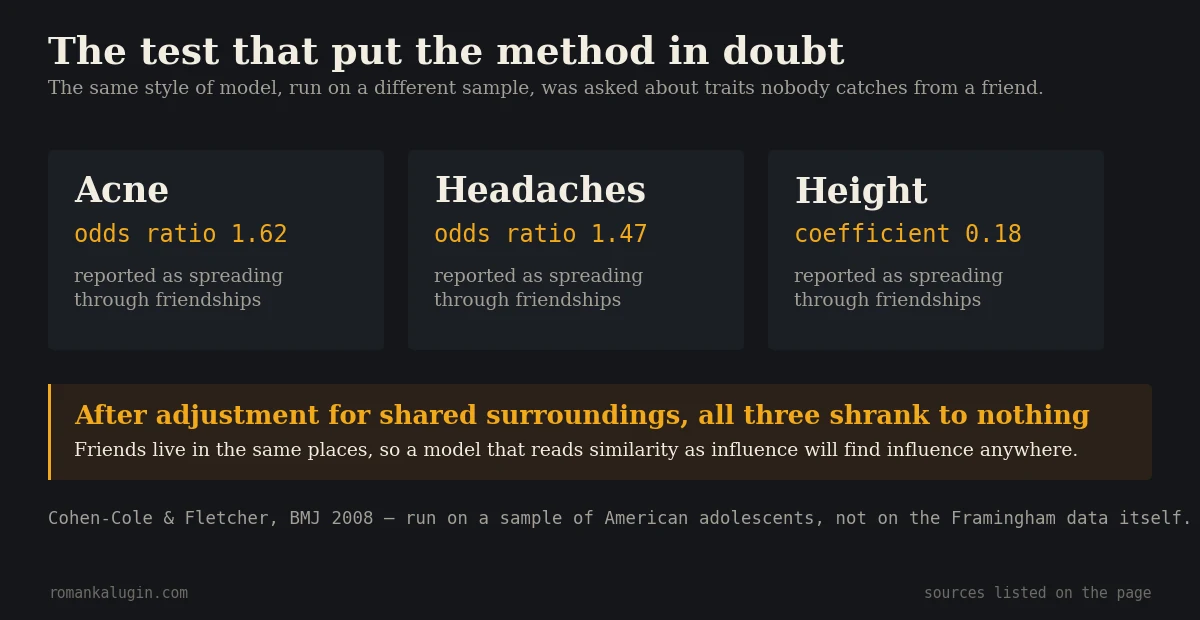
The trouble arrived quickly, and in an elegant form. Ethan Cohen-Cole and Jason Fletcher, two economists working in the United States, took the same style of model, pointed it at a different sample of American adolescents, and asked it about things nobody can catch from a friend.
It reported that acne spreads through friendships. That headaches spread. That height spreads. Once shared surroundings were allowed for, all three shrank to nothing — and their conclusion is that this is what the method does, given friends who live in the same place (Cohen-Cole & Fletcher, 2008). The honest limit on this test: it ran on a different dataset, so it shows how the tool behaves rather than what Framingham contained.
The same authors then took obesity through progressively stricter versions of that stripping-out. The apparent effect fell by a third once each school’s own trend was accounted for, and disappeared into a range straddling zero once every person was compared with themselves over time (Cohen-Cole & Fletcher, 2008). Friends share canteens, gyms, jobs and prices. Take out what they share, and most of the contagion leaves with it.
Then came the objection that does not depend on any dataset at all. People befriend people already like them — sociologists call it homophily, and it is one of the most reliable findings in the field (McPherson, Smith-Lovin & Cook, 2001). Cosma Shalizi and Andrew Thomas, statisticians at Carnegie Mellon University in Pittsburgh, proved that in records where you merely observe who knows whom, becoming alike because you influence each other and being alike from the start cannot be told apart (Shalizi & Thomas, 2011).
That lands directly on the Framingham argument. Its evidence for influence was a lopsidedness: when you named someone as a friend, that person’s weight tracked yours, and when they named you but you did not name them, it did not. Shalizi and Thomas show that a lopsidedness like that can be produced by who chooses whom, without anyone influencing anyone. Russell Lyons, an American mathematician at Indiana University, added seven further objections, among them that the 57% for close friends and the much smaller figure for another kind of tie each sit inside the other’s range of uncertainty — which is another way of saying the two are not distinguishable (Lyons, 2011).
Fairness requires the other side. Christakis and Fowler replied that their estimates sit inside the critics’ own ranges across every specification tested (Fowler & Christakis, 2008), and later wrote that they make no claim to a final word while calling the strongest methodological objection an essentially nihilistic position (Christakis & Fowler, 2013). A third paper, published alongside the objection, tried to settle how much hidden confounding it would take to wipe each finding out: obesity and smoking held up reasonably well, while acne, height and headaches fell over at a touch (VanderWeele, 2011).
And here the trail stops in an unsatisfying place, which we would rather state than paper over. The friendship links were never released. Nobody outside the original team has reanalysed that network, so the 57% has been neither replicated nor overturned on its own numbers — the argument moved to other samples instead. This entry does not declare a winner on Framingham. It says something narrower and sufficient: a contested finding about a network of twelve thousand people cannot license an arithmetic rule about five named individuals.
What holds when you do not choose the people around you
Everything so far concerned people who picked each other. The question underneath the slogan is different: does being near certain people change you? To answer that you need someone else doing the picking — and three places do it by rule rather than by preference. Universities assign roommates. The military assigns squadrons. Employers assign shifts. Each has been studied for twenty-five years, and together they are the strongest thing anyone has on this question.
Grades move a little. The American economist Bruce Sacerdote, who teaches at Dartmouth College in New Hampshire, studied 1,589 randomly assigned first-year students there and found that a roommate one standard deviation better at university (roughly the gap between an average student and a strong one) was worth about .05 of a grade point to you. He declined to read even that as cause and effect (Sacerdote, 2001). In a later sample of 7,672 randomly assigned students the same comparison came to about one hundredth of a standard deviation (Feld & Zölitz, 2017).
A study of 5,272 Chinese students shows where the rest of the popular version goes. Compare roommates raw and the connection looks strong; compare them after accounting for who gets housed with whom and how each student was already doing, and seven-eighths of it evaporates (Cao, Zhou & Gao, 2024). Most of what looks like influence is people ending up together.
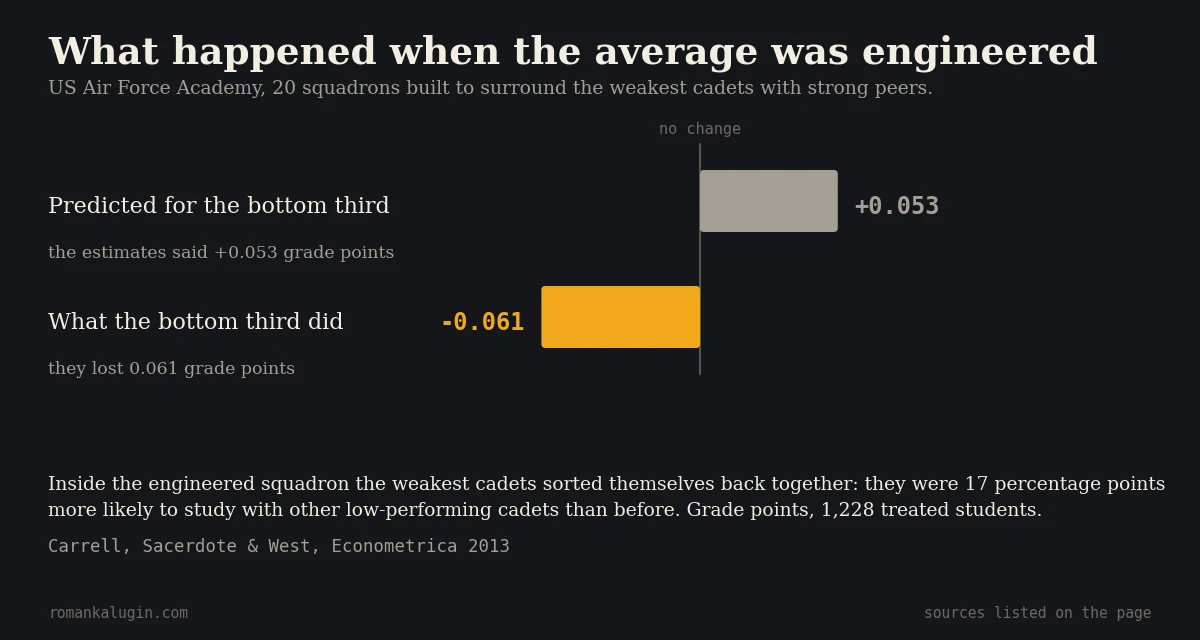
Engineering the average backfired. This is the closest anyone has come to testing the advice the slogan gives, and it deserves the detail. Sacerdote and two colleagues took their own estimates and built squadrons designed to lift the weakest cadets by surrounding them with strong ones, across 20 treated squadrons at the US Air Force Academy. Predicted gain for the bottom third: +0.053 grade points. Observed: −0.061. Inside their engineered squadron the weakest cadets found each other — they were 17 percentage points more likely to study with other low-performing cadets than before (Carrell, Sacerdote & West, 2013). Put someone among people far ahead of them and they may assemble a smaller group of their own instead.
At work, the channel is being watched. Among 394 supermarket cashiers, observed across 1.7 million ten-minute intervals, working alongside faster colleagues raised a cashier’s own output — by 1.5% for a 10% faster set of colleagues. The direction is what makes it interesting: the gain came from colleagues positioned behind them, who could see them work. Colleagues they could see but who could not see back produced the opposite (Mas & Moretti, 2009). Being watched, rather than being inspired.
That checkout aisle is close to the best case. Across 12.8 million worker-years of German records the effect is ten times smaller and shows up only in the most repetitive jobs (Cornelissen, Dustmann & Schönberg, 2017), and among randomly grouped professional golfers it is absent (Guryan, Kroft & Notowidigdo, 2009).
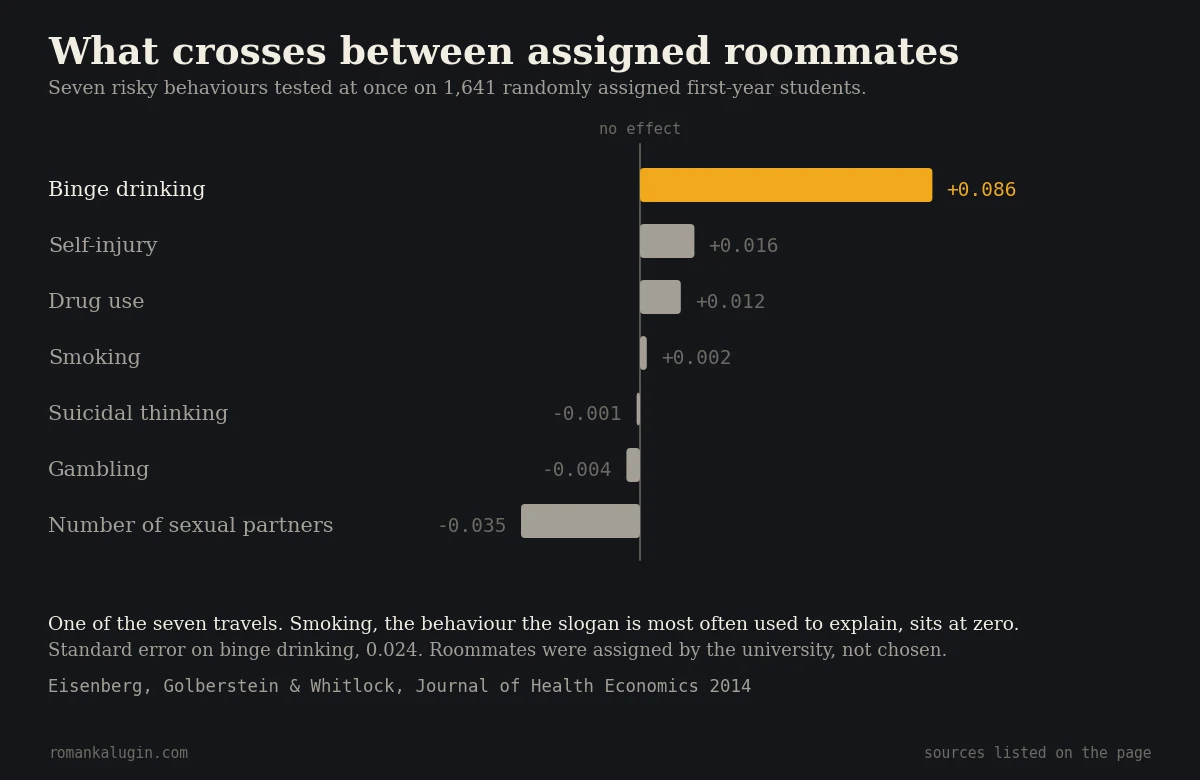
Behaviours travel selectively. One study tested seven risky behaviours at once on 1,641 randomly assigned students, which makes it the cleanest answer to “does it rub off?” that we have. One of the seven moved:
- binge drinking — travels between assigned roommates
- smoking — no effect
- drug use, gambling, number of sexual partners — no effect
- suicidal thinking, self-injury — no effect (Eisenberg, Golberstein & Whitlock, 2014)
Fitness is the other behaviour that moves, and it moves where everyone trains on the same schedule: among air force cadets, a peer’s fitness carried about a third of the weight of the cadet’s own fitness a year earlier, concentrated among the least fit (Carrell, Hoekstra & West, 2011). Weight is stranger. Among military families assigned to 38 installations, children got heavier in heavier counties (Datar & Nicosia, 2018) — while women assigned a heavier roommate gained less weight than average (Yakusheva, Kapinos & Weiss, 2011).
Joshua Angrist, an American economist at MIT who later shared a Nobel prize for work on how to draw causal conclusions from accidents of assignment like these, reviewed the whole field and put it bluntly: designs that manipulate peer characteristics cleanly have uncovered little in the way of socially significant causal effects (Angrist, 2014). Sacerdote’s own review is gentler and lands in the same region — effects show up in drinking, crime and career choice more than in test scores, and they are modest wherever they appear (Sacerdote, 2014).
What should you do instead?
The shift: stop scoring five people and name one behaviour that is visible in the room you already sit in.
First move: pick the behaviour, not the person. Drinking crosses between assigned peers; smoking does not. Fitness crosses where everyone trains on the same schedule. Grades barely cross at all. Asking “who is around me” produces a ranking of your friends. Asking “what do I watch people do here, every day” produces something you can change.
Second move: check who can see whom. The productivity gain among cashiers came from being observed, not from admiring anyone. If you want a group to move you, share a room, a schedule or a scoreboard with it — proximity without visibility did nothing in the strongest work study we have.
Third, be careful about sorting yourself upward. The instruction to swap out the low end of your five was tested about as directly as an idea like this can be, and the students it was designed to help came out worse. If you place yourself among people far ahead of you and then form a subgroup with the others who feel the same way, you have reproduced the experiment.
Fourth, keep the arithmetic away from money. The claim that your income converges on the mean of your five is the most repeated version, and the transfer visible in administrative records runs from parents to children as money and opportunity rather than as attitude — see the money blueprint audit. If your circle worries you for career reasons, the useful questions are concrete ones about the work itself, which is what the signs it is time to change jobs is for.
This claim reached us through a book review — the eagle-and-attitude genre of motivational writing leans on it heavily, and we took it apart there first in the notes on Soar with the Eagles.
The neighbouring claim about who gets ahead, and why, is emotional intelligence as a predictor of success — a number that does exist, and is far smaller than the seminar version.
The boring bottom line
A sentence with no traceable author, no unit of measurement and no study has been repeated for thirty-five years as though it were a result. The proverb underneath it is four centuries old and says something far weaker: your company reveals you. That version was never arithmetic.
The people around you do move you, in specific behaviours, by small amounts, and mostly through being able to see you rather than through being impressive. Anyone who tells you the number is five, and that the operation is averaging, is quoting an answering machine.
Sources
- Zhou, W.-X., Sornette, D., Hill, R. A., & Dunbar, R. I. M (2005). Discrete hierarchical organization of social group sizes. Proceedings of the Royal Society B: Biological Sciences. 272(1561), 439-444. Fractal analysis of pooled human grouping data; layers of roughly 3-5, 9-15 and 30-45, scaling by a factor near three. doi:10.1098/rspb.2004.2970
- Dunbar, R. I. M., & Spoors, M (1995). Social networks, support cliques, and kinship. Human Nature. 6(3), 273-290. British survey of contacts seen at least once a month; describes an inner support clique of about five people. doi:10.1007/BF02734142
- Christakis, N. A., & Fowler, J. H (2007). The spread of obesity in a large social network over 32 years. New England Journal of Medicine. 357(4), 370-379. N = 12,067; the Framingham Heart Study network, seven examinations between 1971 and 2003. doi:10.1056/NEJMsa066082
- Christakis, N. A., & Fowler, J. H (2008). The collective dynamics of smoking in a large social network. New England Journal of Medicine. 358(21), 2249-2258. The same Framingham network, applied to quitting cigarettes. doi:10.1056/NEJMsa0706154
- Fowler, J. H., & Christakis, N. A (2008). Dynamic spread of happiness in a large social network: longitudinal analysis over 20 years in the Framingham Heart Study. BMJ. 337:a2338. N = 4,739, 1983-2003; happiness across the same network. doi:10.1136/bmj.a2338
- Cohen-Cole, E., & Fletcher, J. M (2008). Detecting implausible social network effects in acne, height, and headaches: longitudinal analysis. BMJ. 337:a2533. Add Health adolescents, N = 4,300 to 5,400; the same style of model applied to acne, height and headaches. doi:10.1136/bmj.a2533
- Cohen-Cole, E., & Fletcher, J. M (2008). Is obesity contagious? Social networks vs. environmental factors in the obesity epidemic. Journal of Health Economics. 27(5), 1382-1387. Obesity re-estimated with school-level trends and individual fixed effects; the effect falls into a range straddling zero. doi:10.1016/j.jhealeco.2008.04.005
- McPherson, M., Smith-Lovin, L., & Cook, J. M (2001). Birds of a feather: Homophily in social networks. Annual Review of Sociology. 27(1), 415-444. Review of homophily — the tendency to form ties with people already similar to you. doi:10.1146/annurev.soc.27.1.415
- Shalizi, C. R., & Thomas, A. C (2011). Homophily and contagion are generically confounded in observational social network studies. Sociological Methods & Research. 40(2), 211-239. Analytic result, no empirical sample: homophily and contagion are generically confounded in observational network data. doi:10.1177/0049124111404820
- Lyons, R (2011). The spread of evidence-poor medicine via flawed social-network analysis. Statistics, Politics, and Policy. 2(1), article 2. Seven numbered objections to the estimation and to the friendship-asymmetry test used as evidence of influence. doi:10.2202/2151-7509.1024
- Fowler, J. H., & Christakis, N. A (2008). Estimating peer effects on health in social networks: A response to Cohen-Cole and Fletcher; and Trogdon, Nonnemaker, and Pais. Journal of Health Economics. 27(5), 1400-1405. The authors' reply to Cohen-Cole and Fletcher. doi:10.1016/j.jhealeco.2008.07.001
- Christakis, N. A., & Fowler, J. H (2013). Social contagion theory: examining dynamic social networks and human behavior. Statistics in Medicine. 32(4), 556-577. The authors’ later statement of the theory, published with commentaries from its critics. doi:10.1002/sim.5408
- VanderWeele, T. J (2011). Sensitivity analysis for contagion effects in social networks. Sociological Methods & Research. 40(2), 240-255. Sensitivity analysis: how much unmeasured confounding it would take to overturn each finding. doi:10.1177/0049124111404821
- Sacerdote, B (2001). Peer effects with random assignment: Results for Dartmouth roommates. The Quarterly Journal of Economics. 116(2), 681-704. Randomised roommate assignment, 1,589 Dartmouth first-year students. doi:10.1162/00335530151144131
- Feld, J., & Zölitz, U (2017). Understanding Peer Effects: On the Nature, Estimation, and Channels of Peer Effects. Journal of Labor Economics. 35(2), 387-428. Random assignment of 7,672 students to 3,703 sections at Maastricht University; 39,813 grades. doi:10.1086/689472
- Cao, Y., Zhou, T., & Gao, J (2024). Heterogeneous peer effects of college roommates on academic performance. Nature Communications. 15, 4785. 5,272 undergraduates, 15,680 student-semester observations, roommate assignment at enrolment, with a shuffled-roommate null model. doi:10.1038/s41467-024-49228-7
- Carrell, S. E., Sacerdote, B. I., & West, J. E (2013). From Natural Variation to Optimal Policy? The Importance of Endogenous Peer Group Formation. Econometrica. 81(3), 855-882. Randomised field experiment at the US Air Force Academy: 20 treated and 20 control squadrons, 1,228 and 1,219 students. doi:10.3982/ECTA10168
- Mas, A., & Moretti, E (2009). Peers at Work. American Economic Review. 99(1), 112-145. Six stores, 394 cashiers, 1,718,052 checker × ten-minute observations, 2003-2006; shift scheduling supplies the quasi-experiment. doi:10.1257/aer.99.1.112
- Cornelissen, T., Dustmann, C., & Schönberg, U (2017). Peer Effects in the Workplace. American Economic Review. 107(2), 425-456. German social-security administrative records, 12,832,842 worker-year observations. doi:10.1257/aer.20141300
- Guryan, J., Kroft, K., & Notowidigdo, M. J (2009). Peer Effects in the Workplace: Evidence from Random Groupings in Professional Golf Tournaments. American Economic Journal: Applied Economics. 1(4), 34-68. Random assignment of PGA Tour players to threesomes in the first two rounds; 2002, 2005 and 2006 seasons. doi:10.1257/app.1.4.34
- Eisenberg, D., Golberstein, E., & Whitlock, J. L (2014). Peer effects on risky behaviors: New evidence from college roommate assignments. Journal of Health Economics. 33, 126-138. Assigned college roommates at two universities; analytic sample 1,641 students; seven risky behaviours tested at once. doi:10.1016/j.jhealeco.2013.11.006
- Carrell, S. E., Hoekstra, M., & West, J. E (2011). Is poor fitness contagious? Evidence from randomly assigned friends. Journal of Public Economics. 95(7-8), 657-663. Random assignment to squadrons at the US Air Force Academy; 3,487 students, 13,016 observations. doi:10.1016/j.jpubeco.2010.12.005
- Datar, A., & Nicosia, N (2018). Assessing social contagion in body mass index, overweight, and obesity using a natural experiment. JAMA Pediatrics. 172(3), 239-246. Military families assigned to 38 installations — a posting the family does not choose. doi:10.1001/jamapediatrics.2017.4882
- Yakusheva, O., Kapinos, K., & Weiss, M (2011). Peer effects and the Freshman 15: Evidence from a natural experiment. Economics & Human Biology. 9(2), 119-132. Randomised roommate assignment, female students at a private university; weight change across the first year. doi:10.1016/j.ehb.2010.12.002
- Angrist, J. D (2014). The perils of peer effects. Labour Economics. 30, 98-108. Methodological review of what peer-effect designs can and cannot identify. doi:10.1016/j.labeco.2014.05.008
- Sacerdote, B (2014). Experimental and Quasi-Experimental Analysis of Peer Effects: Two Steps Forward?. Annual Review of Economics. 6, 253-272. Review of experimental and quasi-experimental peer-effect studies. doi:10.1146/annurev-economics-071813-104217
- O'Toole, G. (Quote Investigator) (2022). Quote Origin: You Are the Average of the Five People You Spend the Most Time With. Quote Investigator. Archive search behind the attribution to Jim Rohn quoteinvestigator.com
- O'Toole, G. (Quote Investigator) (2020). Quote Origin: Tell Me What Company You Keep, and I Will Tell You What You Are. Quote Investigator. Fifteen-citation history of the older proverb quoteinvestigator.com
- Canfield, J., & Switzer, J (2005). The Success Principles: How to Get from Where You Are to Where You Want to Be. HarperCollins. p. 189 — earliest documented instance in print, credited to Jim Rohn
- SUCCESS Enterprises (2026). You Are the Average of the Five People You Spend the Most Time With. jimrohn.com. Bylined "written based on the teachings of Jim Rohn"; no study cited jimrohn.com